
Remarkable Market History is Still Being Made
Market Commentary 2Q 2019
March 2019 concluded a 10-year span during which:
- The S&P 500 stock market index has run from 666 in early March 2009 to (as of this writing) 2900 now… a change of 435%. Moreover, there was a sustained, near-zero inflation rate that would normally discount that growth rate, but not during this span.
- There was only one significant market dip… 2011’s May to September decline of 16% which was not considered a Bear phase.
- This remarkable span included no economic “recession” periods.
There are four basic ways that common stocks turn-in such performance:
- They deliver increasing earnings per share and projected future earnings, and/or
- The marketplace values a dollar of earnings at a higher multiple than before, and/or
- The number of shares in the marketplace shrinks, via a significant amount of company buybacks, and/or
- Sustained, heavy demand for equities.
Because public common stocks are traded (and re-priced) in high volume every day, there is a commodity element of their daily price-behavior, i.e., price = supply vs demand. Most of this commodity impact isn’t casually apparent, because designated market-makers in each stock maintain an orderly matchup between buy and sell trades. [To look at a glaring exception, see October 19-20, 1987, when supply vs. demand essentially broke down and, in one day, the Dow Jones fell more than 22%. To view the other side of a less than orderly demand imbalance, see volatile current IPO activity, especially Lyft.]
And now, The FOMO Phenomenon
Because of its long run, there are many who regard the white-hot US stock market as being long-in-the-tooth and, hence, not trusted to deliver further gains without soon giving back a chunk of its 10-year run-up. For many years, we have occasionally published our version of Bull and Bear stock market cycle charts.
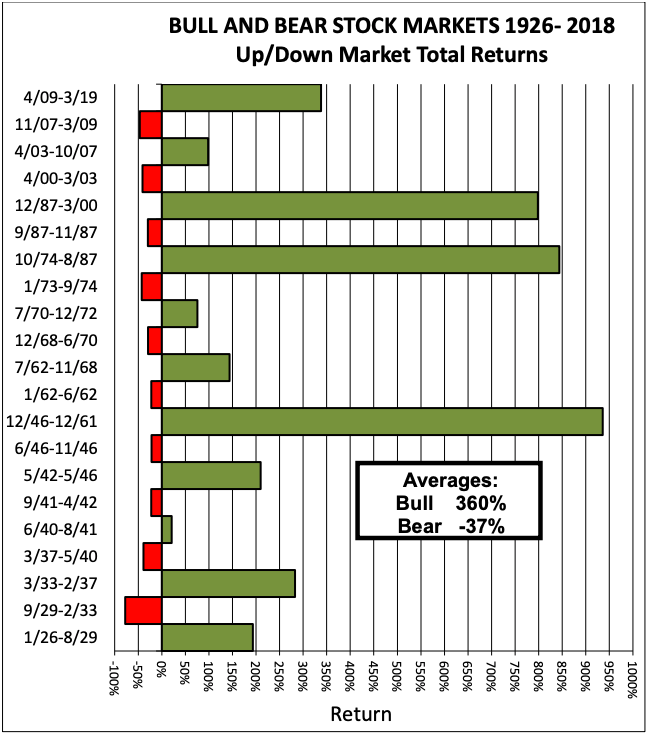
Two aspects are very apparent: Bull market phases are open-ended and tend to last; they don’t die of old age. But, Bear phases (our definition) are sudden and blessedly short-lived. Eleven Bull phases since 1925 averaged a hair under 11 years long, while Bears turned in a puny 1.6-year average duration….
2008 may have taken our collective breath away, but its 1.4-year length was no exception to the quickly-over-with patterns of Bear market history. Note that the current Bull is running a distant 4th place in the 94 years of history in our chart.
With that prelude, we note the latest acronym-fad among a gaggle of stock market buzzers and Tweeters. Indeed, it is a perceived phobia.
They call it FOMO… Fear of Missing Out. It goes like this: There are millions of cautious equity investors who have never really bought into the last 10 years of equity returns. They have undertaken various precautions and tactics to avoid taking The Equity Plunge. Many/most of them are reformed equity devotees who were sucked into the downdraft of 2008 and have resolved to never again be caught naked. Their equity portfolio commitment level has been anemic ever since. Now they listen to Melt-Up Market Mavens crowing from the Internet and flat-screens about the pending opportunity to miss out on yet another major Bull phase, which, allegedly, will be the final Melt-Up, leading into the next massive crash.
The Share Buyback Phenomenon
One increasingly rampant trend in recent years has been publicly owned corporations cannibalizing themselves…. buying up and retiring their own equity, typically ignoring its rising market price, rather than using the shares to expand their businesses. This modern version[1] of buyback programs seems a bit strange when it is executed during periods of a company’s earnings growth and rising share price. Because a buyback squeezes earnings-per-share upward, company boards join with management (whose bonus pay likely floats up with share price growth) in committing significant resources to buying shares which often have no cap on the purchase price. Stranger still, and much more risky, are the companies that issue new debt to execute a buyback program, typically because they have no cash to finance it internally.
When is Debt Not “Leverage”?
Inside of the recent 10-year stock value run-up, US Treasury debt was also more than doubling, from slightly under $10 trillion to more than $22,000,000,000,0002 (of which foreign governments and other foreign investors own 30%, including China’s over-$1-trillion 5%).
So, is the US’s GDP growth (annual total value of all financial transactions within the US) recently keeping pace with Treasury debt growth? In a word, No.
Until 2008, the ratio of Treasury debt to GDP was annually in the 60% neighborhood, having jumped to that level from less than 40% during the 1970s. Today, the Debt/GDP ratio has shot up again, to 102%. After many years of rising, it first topped 100% in 2012. In a paperless, nearly cashless banking world, it was a rather simple matter for the Federal Reserve to create more than 3 trillion new dollars.3
In such an environment, credit-heavy industries soaked up wheelbarrow loads of cheap, new dollars that would buy automobiles, houses and urban commercial/residential buildings. Meanwhile, the Fed invested its new dollars into: (1) buying up essentially all of the US Treasury’s new debt that was being issued to cover the Government’s trillion-dollar annual negative cash flows and (2) buying up most of the new mortgage paper issued by Fannie Mae, Ginnie Mae and Freddie Mac for the home mortgage market. Today, nearly all of those puppies are still on the Fed’s balance sheet; the program to gradually sell them in the open market has been put on hold.
It is not an over-simplification to state that the Fed’s 2008 to 2017 emergency stimulation policy literally created over $3 trillion “out of thin air”. As we wrote while this money-creation period was in full flower, the reason such a made-up monetary scheme could, and did work depended on little more than a warm layer of the world’s collective financial trust…. the belief that those new dollars were, and are “real” and could, therefore, be used to purchase real bond investments, backed by real borrowers who were making real cash debt re-payments. Essentially, the world’s trust is both (a) faith in the stand-alone, organic power of the US’s gigantic economy and (b) the worldwide need to believe in its future power to bridge recessionary canyons. In fact, the Fed’s program was so well received, the European Central Bank, the Bank of Japan and the Bank of England each dived into their own versions. As of now, it is far from clear how, or when those banks, especially Japan, will find a way out.
The China Challenge
During the last 10 years (18 years, actually), China too has been “making money”. In fact, more money (some $30 trillion-worth) than any other country. The catch is, trading partners rarely want to be paid in Renminbi. So, China and all the other countries are typically forced to ground their international trades in greenback dollars, the world’s Reserve Currency.
Will China’s fast growing economy soon catch and surpass the US and thus transplant the Money Throne from New York to Beijing? Highly unlikely. Yes, size matters (a battle that China might win fairly soon), but there are other essential elements of superiority that China does not even fertilize, within its central planning system.
China’s Chairman-for-life may represent stability and control…. the ultimate authoritarian, but he also symbolizes a tarnished lid on China’s global economic potential. China is afflicted by a persistent, government-instilled behavioral gap that freezes out the link between products and the Innovation and Invention that dreamed them up[4]. These two closely linked fundamentals would be essential ingredients for China to overtake the US, and to hold the summit of worldwide economic prowess. But, predictably, neither of these traits is likely to emerge under an economic system which spends extensive human resources on elaborate governmental spy-regimes designed: (1) to criminally steal its way inside the US’s technological framework (topped off by non-criminal Chinese market-entry-price requirements that force US companies to transplant their systems, secrets, strategies and processes into China), and (2) to measure, monitor and manage every trivial aspect of Chinese life and living.
Where Is It All Going?
In brief, (a) the US stock market’s 10-year Bull phase is
not setting any records and it has no indications that its momentum is running
on fumes; (b) the world today is quite happily wallowing in far, far more money
than existed ten years ago. If central banks find reward, rather than
price-to-pay for having created that money, why wouldn’t they continue? Why
wouldn’t they even expand those programs?
Commentary
Commentary was prepared for clients and prospective clients of FiduciaryVest LLC. It may not be suitable for others, and should not be disseminated without written permission. FiduciaryVest does not make any representation or warranties as to the accuracy or merit of the discussion, analysis, or opinions contained in commentaries as a basis for investment decision making. Any comments or general market related observations are based on information available at the time of writing, are for informational purposes only, are not intended as individual or specific advice, may not represent the opinions of the entire firm and should not be relied upon as a basis for making investment decisions.
All information contained herein is believed to be correct, though complete accuracy cannot be guaranteed. This information is subject to change without notice as market conditions change, will not be updated for subsequent events or changes in facts or opinion, and is not intended to predict the performance of any manager, individual security, currency, market sector, or portfolio.
This information may concur or may conflict with activities of any clients’ underlying portfolio managers or with actions taken by individual clients or clients collectively of FiduciaryVest for a variety of reasons, including but not limited to differences between and among their investment objectives. Investors are advised to consult with their investment professional about their specific financial needs and goals before making any investment decisions.
Investment Risk
FiduciaryVest does not represent, warrant, or imply that the services or methods of analysis employed can or will predict future results, successfully identify market tops or bottoms, or insulate client portfolios from losses due to market corrections or declines. Investment risks involve but are not limited to the following: systematic risk, interest rate risk, inflation risk, currency risk, liquidity risk, geopolitical risk, management risk, and credit risk. In addition to general risks associated with investing, certain products also pose additional risks. This and other important information is contained in the product prospectus or offering materials.
1 Historically, profitable companies with stagnant share prices used buybacks as a means to utilize available resources and stimulate the public market value. Such low risk programs typically included a share price limit that would halt the buyback program
2 Almost $3 trillion of Treasury debt is held by the Social Security “trust funds.” This money accounted for as trust fund “investments” represents the net FICA tax collected since 1964 from employers and working Americans’ paychecks. Rather than investments held in trust (as it had been through 1963), that net FICA money has been spent every year for general government expenses, leaving behind a 55-year trail of IOUs from the Treasury. These special Treasury IOUs cannot be sold to bond market investors. So, when needed (starting next year) to pay SS benefits, the Treasury must raise more money to pay off the IOUs, on demand, at face value.
3 New dollars” includes an increased amount of currency in circulation, created by the Treasury, which doubled it from $0.8 to $1.7 trillion.
4 THE seminal, unique Innovation/Invention event of the 20th Century (and longer) occurred in 1969. Apollo 11’s manned moon landing and safe return, even today captures all of what American Innovation and Invention was, and still is about. The entire mission was built on a dream floated only 8 years earlier by President Kennedy. It unfolded an incredible stream of human ingenuity, assisted by “primitive” computers, which has not even been duplicated in the 50 years since.