Now What?
In our April 1, 2020 Commentary, three months before the coronavirus was declared a pandemic and in the depth of economic woes and a stock market crash, we sought to answer everyone’s key questions: How much gloom will hang over the stock markets, and for how long? How will large negative corporate earnings for some number of quarters ahead come to roost on stock valuations?
We said we didn’t know. But we did give a predictive answer we considered to be realistic, hopeful, and more important: We said the market would likely ignore the negative earnings quarters that lay ahead. We said that by or before December 31, the market would value itself by looking straight ahead, into 2021. We were quite sure that the stock market wouldn’t buy into the dark vision of a long-term pandemic scenario, no matter how bad the virus came to be.
We made it; we’re finally free of 2020
Once again, markets have told us that elections, even those with high drama, don’t cause much excitement for them.
This time, there is actually a more than usual impact from the political policy camp. This time, the production of “stimulus” money… Congress loves that word… will close the unfinished loop that was left over from year-end 2020’s “token” $1 trillion cash distribution package. Within weeks, robust new numbers will be inserted into cash payout legislation that will distribute almost $2 trillion more manna, which neatly adds up to a few bucks less than the $3 trillion total that now-in-power Democrats fought and failed to get in late 2020. The new money will provide a second lifeboat for small businesses devastated by forced pandemic shutdowns. Tragically, the fresh supply of business-continuance cash will only help those that survived; so many did not. As for the checks that will soon show up in home mailboxes, mid-2020 experience suggests that people will tend to avoid spending most of it on goods and services. So far, the depth of pandemic America’s punchbowl has not been plumbed. Just in the past 12 months, the Federal Reserve has created $3 trillion of money that did not exist a year ago; its total assets are now $7 trillion. Of that new money, only $300 billion (10%) was in the form of new currency in circulation. That was then, this is now: the planned 2021 distribution of 2 trillion more dollars within weeks, via the US Treasury’s issuance of new debt which the Fed will predictably buy up and pay for using more newly created dollars. That financial exercise will drive the Fed’s trailing 12-month money-creation binge to $5 trillion… a 12 month increase which amounts to almost 6X the Fed’s entire asset pool before its new money policy began in early 2008.
Market Melt-Up?
Are we in a stock market bubble? If so, will it end in a(nother) crash? What to watch? How to prepare?
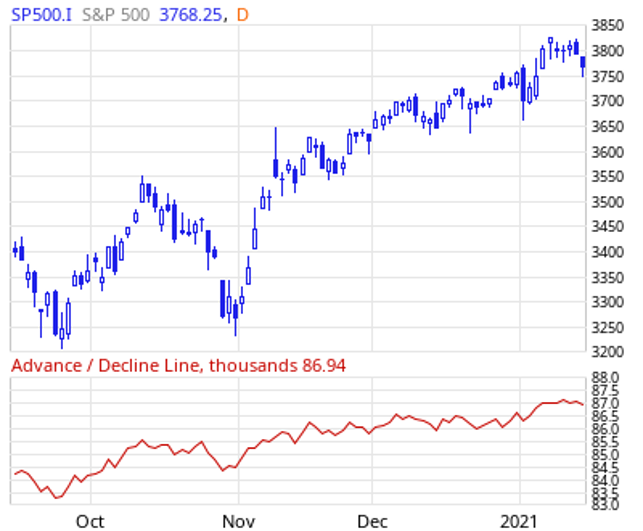
The US stock market has been a marvel ever since its super-quick, V-shaped crash and recovery between late February and late March 2020. Technology sector stocks have seen an incredibly persistent run. And the beat goes on. How can you watch for signs of emerging market weakness? There is one very simple, very available indicator that serves this purpose: the Advance-Decline (A-D) Line. Every day, it measures the number of stocks that rose and subtracts the number of stocks that fell. It can’t be depended upon to predict a crash, versus a temporary market pull-back, but it is useful because it is a visual indicator and because history shows that markets tend to show A-D weakness in front of a general decline, when their relevant market index (S&P 500, etc.) is still rising. The reason for that signal is that the A-D line is equal-weighted… every stock gets the same weight, whereas each stock in popular market indexes is market-size weighted.
The S&P500’s current A-D line is showing nothing more than a slight downward tendency.
The next Big Thing
The 21st Century to date has seen a global efficiency revolution at every level of production. The sources of efficiency improvements have stemmed from basically one two-part source: (a) massive dissemination of the worldwide internet and (b) an exponential stream of technology designed to exploit the internet. In only 20 years or so, newly created internet-driven businesses, along with a total overhaul of “legacy” businesses, have pushed the economies of nearly every nation into the highest gear. The new era came with such speed that it is without precedent. The first Industrial Revolution lasted almost 100 years. (On the negative side of speedy development: a persistent, worldwide gaggle of internet hackers is busily offsetting a portion of every internet efficiency gain.)
All of the above leads us to a conclusion about the most significant macro-economic/investment development of the next 5 to 10 years: It will be Inflation. How so? First, let’s clearly define inflation. It is not caused by wage and price increases. Instead, inflation is shrinkage in the purchasing power of each dollar…. Hence, inflation is dollar devaluation, which directly pushes up the price of goods, services and wages. Currency devaluation translates a newly printed money-dump into higher prices, because when additional dollars are created… out of thin air… the purchasing power of both the old and new dollars decreases.
Persistent inflation (unless indexed) devalues essentially every investment and forward payment financial transaction.
The inflationary impact of dollar-expansion will be offset, at least somewhat, if the production of goods and services becomes continuously more efficient. (Indeed, if there is zero inflation, a market economy’s goods and services will actually cost less, over time, because of ongoing production efficiency improvements.) For example, early 1960s models of “mainframe” computers were run by hot cathode ray tubes, driven by punch-cards and festooned with similar antique components. Those room-size machines were very expensive to buy and they gulped huge amounts of electric power; consequently, mere hundreds of them existed, mostly owned by large banks and the US Defense Department. Another example: 1980s $1,500 – $2,000 portable telephones and “car phones” were heavy, cumbersome analog boxes operated with a corded receiver and served by skimpy signals.
You probably know that the Federal Reserve’s 1913 Congressional Charter charges it to pursue three core goals: (1) maximum employment, (2) stable prices, and (3) moderate long-term interest rates. But, in 2011, the Fed Open Markets Committee decided (via murky reasoning) that, in order to achieve both full employment and stable prices, they should set an annual inflation target rate; that target was then, and still is 2%. Ever since, the Fed has failed to achieve its target. The Fed of course knows, better than we, that its aggressive, multi-trillion-dollar money printing policy will overwhelm the US economy’s efficiency gains. Inflation will return, likely with gusto.
In 2020 and for several more years coming, the Fed announced that the inflation target would be allowed to float “a little” beyond 2%. But we should note that 2% annual inflation compounds to almost 22% in 10 years… buy a $30,000 car today; its replacement will cost $36,500 in 2031.
Investing for Inflation-avoidance
While, as we said previously, inflation devours debt investments, especially long term, fixed interest rate bonds, the not-very-popular Treasury Inflation Protected Securities (TIPS) are designed to handily recover the ravages of inflation. Although TIPS typically pay below-market rates of interest, the inflation-sensitive principal feature is a near perfect solution, and, in addition, it also has full US Government credit backing. In our view, long maturity TIPS have one risk that is the same as all long-term bonds: “interest rate risk” (rising market rates will hurt the long-term TIPS investor), while the inflation-protection feature is fully operative in short maturity TIPS that have little or no interest rate risk.
Persistent inflation (unless indexed) devalues essentially every investment and forward payment financial transaction.
Rich are getting richer and the internet-rich are multiplying
The simple scaling up of a new product’s production and distribution typically causes its selling price to fall significantly. Software is a best-case example. Product development often requires very little monetary investment, no factory, little payroll and no custom-built equipment; it must have an ample supply of computer science, which comes inside the heads of a very small handful of entrepreneurs. The product goes on the market and positive cash flow is almost immediate. After a testing period and a bit of advertising expense, the business becomes “obscenely” profitable, because it has zero need to build warehouses, incur delivery costs, or hire an army of technicians. (More likely: one of the big fish among software producers comes with an offer to create yet another billionaire or two.)
One of the economic marvels of the 21st Century is the lightning-speed translation of internet-driven technology into wealth accumulation. As we said, virtually all businesses have been either created, or completely transformed and, in the process, delivered massive individual wealth. But that wealth is highly concentrated among a relatively small number of equity owners, causing a wave of concern among elected public officials and business leaders… They call it “income inequality”… a very poor label, we think, because the situation is neither about income, nor about somehow equalizing it. Instead, it’s about wealth imbalance, i.e., the systemic fact that owning a company’s stock which rapidly grows in value and, via compounding, delivers a fortune, accumulated with, or without the investor’s effort (and without paying taxes during the accumulation).
So, we now have a list of top-ten wealthiest Americans, nine of whom made their fortunes by riding the tectonic shift from an analog society into a digital one. The list includes Amazon’s Jeff Bezos ($187 billion), Tesla/SpaceX’s Elon Musk (recently $167B), Microsoft’s Bill Gates ($131B) & Steve Ballmer ($79B), Facebook’s Mark Zuckerberg ($105B)[1], Oracle’s Larry Ellison ($80B), Google’s Larry Page & Sergey Brin ($160B). The remainder of the wealthiest list is topped by long time conventional investor for many decades, Warren Buffett ($85B), who is well respected because he thinks straight, talks straight and acts accordingly.
Note: Of the 5 wealthiest, only Bezos has not (yet) joined The Giving Pledge to donate more than 50% of his wealth to charity.
Big-time wealth is controlled by workers
The imbalance of wealth is actually less discriminatory than so many column writers (and candidates for US President) would have us believe. They uniformly overlook the fact that:
- more than 137 million[2] working and retired Americans have more than $9 trillion invested3 in a growing accumulation of their contributions to 401(k) and other savings plans sponsored and nourished by their employers, without current income taxation,
- plus another $11 trillion[3] similarly invested within Individual Retirement Accounts (IRAs).
Inside of those accounts, there is opportunity for everyday workers to allocate some, or all their money to common stocks, including the same stocks that have made internet-driven Fat Cats into multi-billionaires over the past 20 years.
[1] The Winkelvoss twins have parlayed their Facebook settlement into cryptocurrencies, recently worth $2 billion.
[2] US Dept of Labor 2017 Abstract (latest available)
[3] At the end of 2019, according to Morningstar report dated September 2020
Commentary
Commentary was prepared for clients and prospective clients of FiduciaryVest LLC. It may not be suitable for others, and should not be disseminated without written permission. FiduciaryVest does not make any representation or warranties as to the accuracy or merit of the discussion, analysis, or opinions contained in commentaries as a basis for investment decision making. Any comments or general market related observations are based on information available at the time of writing, are for informational purposes only, are not intended as individual or specific advice, may not represent the opinions of the entire firm and should not be relied upon as a basis for making investment decisions.
All information contained herein is believed to be correct, though complete accuracy cannot be guaranteed. This information is subject to change without notice as market conditions change, will not be updated for subsequent events or changes in facts or opinion, and is not intended to predict the performance of any manager, individual security, currency, market sector, or portfolio.
This information may concur or may conflict with activities of any clients’ underlying portfolio managers or with actions taken by individual clients or clients collectively of FiduciaryVest for a variety of reasons, including but not limited to differences between and among their investment objectives. Investors are advised to consult with their investment professional about their specific financial needs and goals before making any investment decisions.
Investment Risk
FiduciaryVest does not represent, warrant, or imply that the services or methods of analysis employed can or will predict future results, successfully identify market tops or bottoms, or insulate client portfolios from losses due to market corrections or declines. Investment risks involve but are not limited to the following: systematic risk, interest rate risk, inflation risk, currency risk, liquidity risk, geopolitical risk, management risk, and credit risk. In addition to general risks associated with investing, certain products also pose additional risks. This and other important information is contained in the product prospectus or offering materials.