
The End of 2022…At Last
By almost any measure, 2022 was a lousy investment year (even for typically boring bonds). In fact, of 68 different investment market indexes that we track, only 3 had positive returns…. US Treasury bills (+1.5%), Latin American stocks (almost +9%) and the eye-catching one was Energy [Alerian MLP] (+25.4%).
The S&P 500 market-weighted stock index (including dividends) fell just over 18%. But, hiding under that figure was its two major sub-indexes, the S&P500 Growth stock index which fell 29%, while its Value stock counterpart declined only 5%.
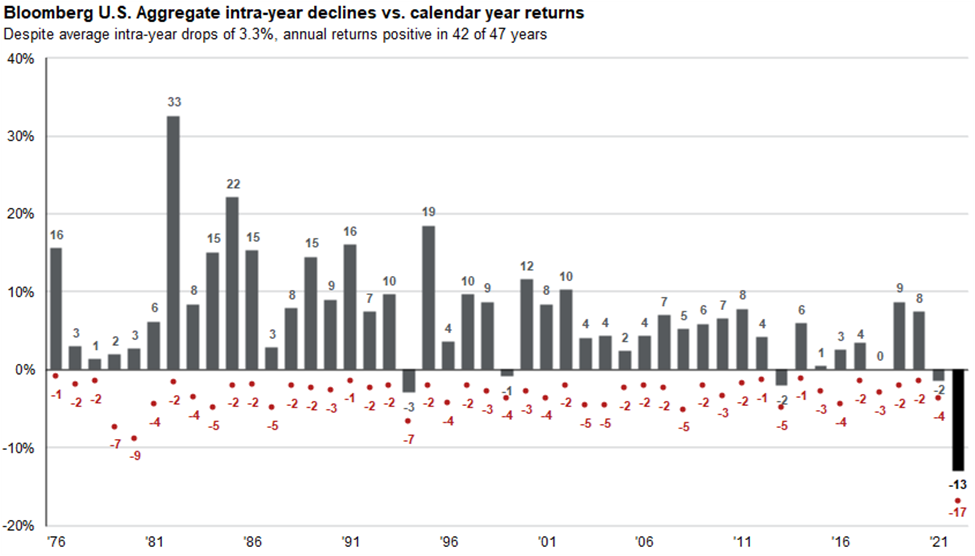
At the bottom-end of that list of 2022 indexes was the NASDAQ 100 market value-weighted composite which fell by 33%. We note that just over half of the NASDAQ is in its Tech Sector component. (An equal-weighted version of the index lost a whopping 43% in 2022.) So much for stocks. Bond indexes also had a very rough year. The worst on the list was the 30-year inflation-protected US Treasury bond index [TIPS] which plunged by 41%. Even the bellwether Bloomberg Aggregate Bond Index was down -13% in 2022, far exceeding its prior calendar year loss record of -2.9% back in 1994.
Guide to the Markets – U.S. Data are as of 12/31/2022
Mortgage lending rates were hard hit; a 2.25%, 15-year mortgage in January 2022 blew out to triple that interest rate by summertime, after a quick start in March of the Federal Reserve’s aggressive, endlessly discussed commitment to tame the national inflation rate back to its permanent 2% target, via a continuous stream of hikes in the nation’s lending rates. One intended effect was certainly achieved as home sales declines more than 35% on a year-over-year basis as of November.
Why do we Care About Calendar Year Investment Returns?
Funny thing about time measurements. In the Dark Ages, people naturally and logically came to see their world in terms of repeating weather cycles; in most parts of the globe, mankind and womankind saw that life-giving agricultural crops came and went in four repeating weather sets of time. It did not take long for primitive humans to count and measure things in a 4-season format. During Roman Empire times, when our modern calendar was developed, various emperors were attracted to naming the recurring periods after themselves; they cut and sliced the calendar until they agreed on 12 sub-periods, within the 4 seasons.
Fast-forward to the 20th Century, when a significant number of investment researchers had a crucial need to make multi-time-period statistical measurements for comparison purposes. They recognized that, in order to use statistics for reporting their studies, they needed to agree on universal measurement standards. Quite naturally, the most convenient unit of time was the centuries-old, 365-day calendar format. So, there you have it; computer-age statistical measures of investment history were, and still are expressed in the ancient terms of 12-month weather cycles. [Calendar year measurements actually do make sense, if we are measuring the investment returns from annually cyclical industries, such as the retail clothing industry.]
Next, an investment analysis tool called Time-Weighted Return (TWR) was invented to measure multi-year returns that would be un-affected by any in and out cash flows (i.e., “annualized” returns). Annualized is a curious unit of measure because returns are measured in two or more successive four-season groupings which, in turn, have little relevance to investors’ need to set reasonably dependable outcome-expectations. Investments in bonds can sort-of fit the 12-month mold, but the total returns from common stocks are almost never calendar-driven, because their valuation is driven by companies’ forecasted future bottom-lines.
When common stocks are significantly involved, an investor’s time horizon must necessarily be multi-year. Studies at FiduciaryVest found that the most predictable time-unit for forecasting expected returns from a portfolio of daily-traded, well diversified common stocks is about 8 years. Translation: if an investor’s desired results-horizon is significantly shorter than 8 years, then that investor’s exposure to an unacceptable outcome, i.e., “risk,” is elevated.
Inflation Ahoy!

The price of eggs is not just a hokey, antique reference. A dozen medium-size eggs is a core yardstick because twelve eggs are a fundamental unit that hasn’t changed over very long periods of time and the supply and demand for eggs does not fluctuate much, although an episode of bird flu did cause a temporary reduction in the supply-side of eggs which likely created some of eggs’ 2022 price inflation. We can therefore use eggs as a true measure of price inflation.
Just in time for this Commentary, the price of a dozen eggs was announced for November 2022; it increased by a shocking 49% during the preceding 12 months. As with investment returns, the inflation rate in the US and the rest of the world is also measured in annual terms. But inflation, unlike common stocks, has not been cyclical. Instead, it moves rather steadily upward over time. Measuring the rate of inflation is trickier than measuring returns from bonds, or stocks, because the benchmarks for measuring inflation include inflation. Inflation of retail product prices can sometimes be reduced by way of content DEflation. Example: A package of saltine crackers may be exactly the same size as a year ago and contain the same number of crackers that are the same size. But, the individual crackers may contain additional air and the batter may contain slightly more water, both of which will hold down the cost of ingredients and allow the sale price to be only slightly higher than last year. (There may be a side effect: consumers might find that deflated crackers will no longer hold a tasty spread without disintegrating.)
Inflation vs. Money
A few benchmarks that are popular (and logical) “inflation-gauges” are:
- The prices of universal necessities, such as:
- consumption commodities: fuels, groceries, water, pharmaceuticals
- natural compound commodities: timber, soil
- The prices of universally valuable natural element commodities: precious metals, jewels, copper
- Sovereign currencies.
All of the above have been used, quite often, as a medium of exchange, i.e., money. Money is often valued in terms of other money, which makes it very important that other forms of money must not themselves have volatile changes in value.
As an offshoot of the World Wars in the early 20th Century, international trade grew rapidly and, in 1944, at the end of World War II, the US Dollar was anointed, by agreement among nations as the base (reserve) money-benchmark; it replaced the British Pound Sterling, because that previously far-flung empire had largely disintegrated.
So, for a century now, because of the US’s sustained economic growth, the US Dollar has served as the reserve pool for nations representing all other currencies. The dollar is the universal “denominator” for the settlement of most international trades. Before 1971, the US Dollar’s history had mostly tied its value to the price of gold which, until that year, had been the world’s traditional “monetary metal” for many centuries, across nearly all countries, empires and fiefdoms. But amid the Great Depression in 1933, gold’s price became “fixed” by the US Government which then confiscated nearly all privately-owned gold, at the fixed price, in order to remove it from open market trading. In practical terms, that amazing act of a democratic Government removed gold’s “backing” of US Dollars and initiated the Federal Reserve’s absolute control over the unlimited creation and issuance of US money….It implanted a piggy bank that could grow its contents without external input or discipline. There was no longer any lid on Government outlays, such as funding the participation in always expensive foreign wars.
2023 marks a centennial, of sorts; it’s the 100th anniversary of the total collapse of the infamous German Mark issued by the Weimar Republic. In 1914, Germany had abandoned the gold backing of its currency and then it brazenly started a war with most of Europe that it expected would be finished in a few months (sound familiar?). At that time, it took four German Marks to buy one US Dollar. After four years, Germany had surprisingly lost the war, but not the war’s debts; its post-war economy was in no shape to support any new taxes. The Treaty of Versailles required Germany to fund an impossible amount of reparations to the Allied governments, to be paid in gold-backed Marks. So, by 1923, Germany’s currency had completely lost any economic meaning. It took one trillion Marks (approximately) to buy that one US Dollar.
How did the US get blind-sided by sudden 2021-22 inflation?
In brief, it was too many newly created dollars in a relatively short period.
The financial crisis of 2008, caused by the creation of rampant, under-collateralized private and corporate debt set up a vacuum that pulled the Federal Reserve’s manipulation-toolbox into a tender trap. The Fed blew up the money balloon that would steer the massive number of credit seize-ups away from bankruptcies and into stable zombie-hood… for a while.
The 2009/10 threat of financial relapse seemed so pressing that the Fed’s money-printing policy was simply continued full bore, beyond economic recovery and into robust growth that would thrive and flourish on one Big Thing: near-zero interest borrowing rates… for an incredible 14 years
Those super-low rates compressed the entire bond market into an interest structure that required a microscope to examine it. Conversely, the stock market never had it so good. The artificially low rates meant that banks would loan on projects that could be built, very profitably, at low cost; it also meant that otherwise unsustainable companies could stay afloat on low-cost borrowings that would keep them going until rising interest rates would take them down. And it also meant that, unlike 2008, 15-year home mortgages could be used by moderate-income borrowers to buy their idea of a palace. And big-time home buyers could finance true palaces in exotic locations that could be reached aboard their cheaply financed private jets. Technology-based companies produced multi-billion-dollar wealth entirely from massive scaling of their products. The valuations of tech companies soared to 30, 40…. 60 times their current earnings.
It all seemed copacetic. And then, without warning, the Covid-19 pandemic of 2020 struck and, in a matter of weeks turned all global economies into non-functioning shells. The US Congress quickly proved that it can actually function as a single political entity. It wove “rescue” legislation, with uncharacteristic swiftness. The comprehensive and bi-partisan CARES Act of mid-2020, followed by another one in late 2020 and finally the American Rescue Plan Act of March 2021 quickly translated into widespread price run-ups in goods and services.
According to USASPENDING.gov, through September 30, 2022 (it’s not finished), the actual paid-out Federal response to Covid 19 was $4.55 trillion which is about one-fifth of this year’s expected $25 trillion US economy.
Below is a chart we created on macrotrends’ data site that we find interesting, because it actually simplifies how we can measure inflation.
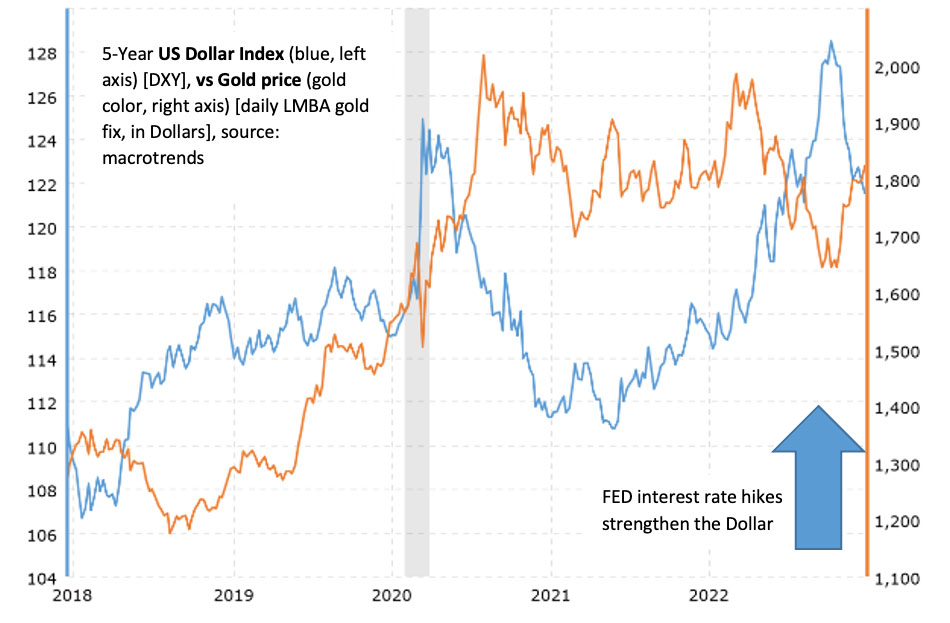
The dollar is worth more, or fewer Euros, Yen, etc. on a given day based on currency market trading activity. But, because all major currencies (except the Swiss Franc) are designed to mirror the US Fed’s money-creation structure and techniques, the world’s markets are daily valuing all currencies in terms of each other. For dollar owners, a rising dollar valuation translates into lower prices of internationally bought and sold goods and services. The chart on the previous page shows (in blue) the past 5 years of dollar value fluctuation, measured by a trade-weighted basket of six other currencies (of which the Euro usually represents between 50% and 60%). In the chart, we see that the Fed’s interest rate hikes had the effect of lifting the international market value of the dollar in 2022, because most of the other central banks did not immediately raise rates, or are doing so more slowly than the US.
Is Gold Relevant?
Although none of the world’s major currencies are tied to gold’s price, gold is nonetheless an unchanging international benchmark; it has no internal characteristics which drive changes to its market value. It is not a true commodity (i.e., not priced according to changes in its supply/demand). Instead, the fluctuations in gold price are direct reactions to the value of currencies that are used to buy and sell it. So, the “independence” of gold pricing from all fiat currencies that have essentially unlimited supply, gold is a useful indicator of those currencies’ inflation.
Two Primary Inflation Indicators have strong Negative Correlation:
Weak Dollar = strong gold, and vice versa
Today, the US Federal Reserve is not constrained by printing presses, or anything else that is physical. It creates new dollars with a keystroke, and that same stroke allocates billions of dollars onto the books of the Fed’s regional banks and their commercial banks. They, in turn purchase real US Treasury bonds and mortgage-backed bonds, in the real bond markets, to hold as “capital” on their balance sheets. This daisy-chain of money creation and offsetting Fed “investment” soared from less than $1 trillion of short-term securities in early 2008 to $9 trillion of mostly long-term bonds recently (equal to almost one-third of US GDP last year). The next Fed move… gradually selling those bonds and “retiring” the dollars received in the sale will likely be unprecedented and stressful to manipulate without causing unwanted market reaction.
Commentary
Commentary was prepared for clients and prospective clients of FiduciaryVest LLC. It may not be suitable for others, and should not be disseminated without written permission. FiduciaryVest does not make any representation or warranties as to the accuracy or merit of the discussion, analysis, or opinions contained in commentaries as a basis for investment decision making. Any comments or general market related observations are based on information available at the time of writing, are for informational purposes only, are not intended as individual or specific advice, may not represent the opinions of the entire firm and should not be relied upon as a basis for making investment decisions.
All information contained herein is believed to be correct, though complete accuracy cannot be guaranteed. This information is subject to change without notice as market conditions change, will not be updated for subsequent events or changes in facts or opinion, and is not intended to predict the performance of any manager, individual security, currency, market sector, or portfolio.
This information may concur or may conflict with activities of any clients’ underlying portfolio managers or with actions taken by individual clients or clients collectively of FiduciaryVest for a variety of reasons, including but not limited to differences between and among their investment objectives. Investors are advised to consult with their investment professional about their specific financial needs and goals before making any investment decisions.
Investment Risk
FiduciaryVest does not represent, warrant, or imply that the services or methods of analysis employed can or will predict future results, successfully identify market tops or bottoms, or insulate client portfolios from losses due to market corrections or declines. Investment risks involve but are not limited to the following: systematic risk, interest rate risk, inflation risk, currency risk, liquidity risk, geopolitical risk, management risk, and credit risk. In addition to general risks associated with investing, certain products also pose additional risks. This and other important information is contained in the product prospectus or offering materials.